
By the time a product hits your TikTok feed, the money is already made. Someone found it three weeks earlier, tested it quietly, and scaled it while you were still scrolling. Product research by feed-scrolling is not research. It is window shopping at a store that closed last month. The merchants who win at this game do one thing differently: they look at data, not at their For You page. This guide shows you how that actually works.
Why Your Feed Lies to You
TikTok and Instagram show you what is already winning. That is the entire design. The algorithm pushes content with proven engagement, so every winning product you see organically has already been served to millions of people. By the time you source it, build the store, and launch ads, you are competing with fifty other sellers who watched the same video. Margins are gone. CPMs are up. You are late to a party that ended yesterday.
Manual scrolling has a second problem. It costs you hours and returns opinions instead of numbers. You cannot sort your feed by ad spend. You cannot filter it by growth rate. You are guessing with extra steps.
The Methodology: Hunting Early Momentum
A winning product is not a product with a million likes. It is a product whose numbers are accelerating right now. That difference decides who profits. All-time metrics tell you what happened. Velocity metrics tell you what is about to happen. Three signals separate early momentum from yesterday's news:
- Ad spend velocity: how fast a seller increases budget on an ad. One store doubling its spend this week means the ad converts. That is the strongest buy signal in this business.
- Three-day engagement rate: likes, comments, and shares from the last 72 hours, not all time. A product with 40,000 lifetime likes and flat recent engagement is dead. One with 3,000 likes that doubled since Monday is alive.
- Comment sentiment: read the actual comments. 'Where can I buy this' is buying intent. Ten laughing emojis and a scam accusation are a warning, no matter how pretty the view count looks.
Notice what is missing from that list: the product itself. Cool factor does not pay. At this stage you are not judging whether you like the item. You are judging whether the market is starting to vote for it with attention and money. Taste comes later, when you build the offer.
Tracking these numbers by hand across millions of ads is impossible. This is where spy tools earn their subscription. Two of them are worth your money, and they cover different ground.
The Toolkit: Reading the Numbers Like an Analyst
Minea: Cross-Platform Ad Tracking
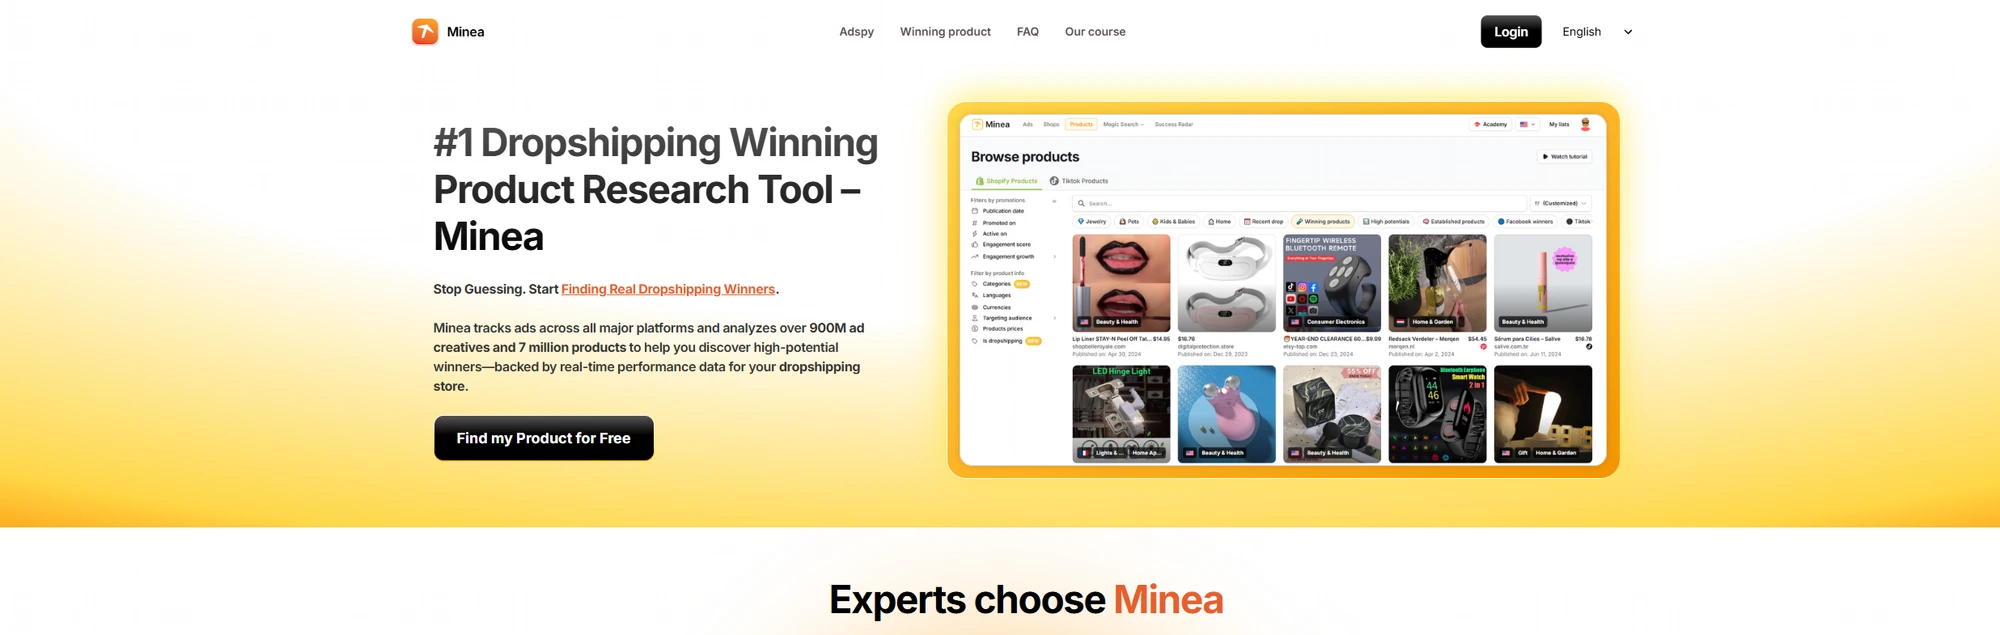
Minea watches ads across Facebook, Pinterest, and TikTok, and its real edge is the cross-platform view. A product scaling on Facebook while quietly appearing on Pinterest is not a coincidence. It is a seller finding a second profitable channel, which means the product has legs beyond one audience.
Here is the filter setup I use for early detection. Set the ad date to the last 14 days. Sort by engagement growth, not total engagement. Then filter for ads targeting tier-2 markets like France, Germany, Italy, or Spain. Smaller sellers test there first because clicks are cheap and competition is thin. When you spot a product with rising momentum in a tier-2 country that nobody has pushed hard in the US or UK yet, you have found the gap. That gap is where your margin lives.
Pinterest deserves a special mention here. Most sellers ignore it, which is exactly why it works as an early indicator. When a product starts getting pinned and advertised there, the trend is usually two to three weeks away from peaking on TikTok. Catching it in that window is the entire game.
One more Minea habit: check who promotes the ad. If one small store is behind it and scaling, you can still ride the wave. If five big stores are already on it, walk away and find the next one.
Peeksta: TikTok Spying and Store Tracking
Peeksta is built for TikTok, where most product trends are born now. Its TikTok ad library shows what sellers are paying to push, not what the algorithm decided you should see. That distinction is everything. Paid spend is a confession: nobody burns budget on a product that does not sell.
The store tracking feature is the part most people ignore, and should not. Add any store selling a product you watch, and Peeksta estimates its revenue and order volume over time. A product with pretty ads and a store doing 300 dollars a day converts. Pretty ads with a dead store means good creative wrapped around a broken offer. You want the first one.
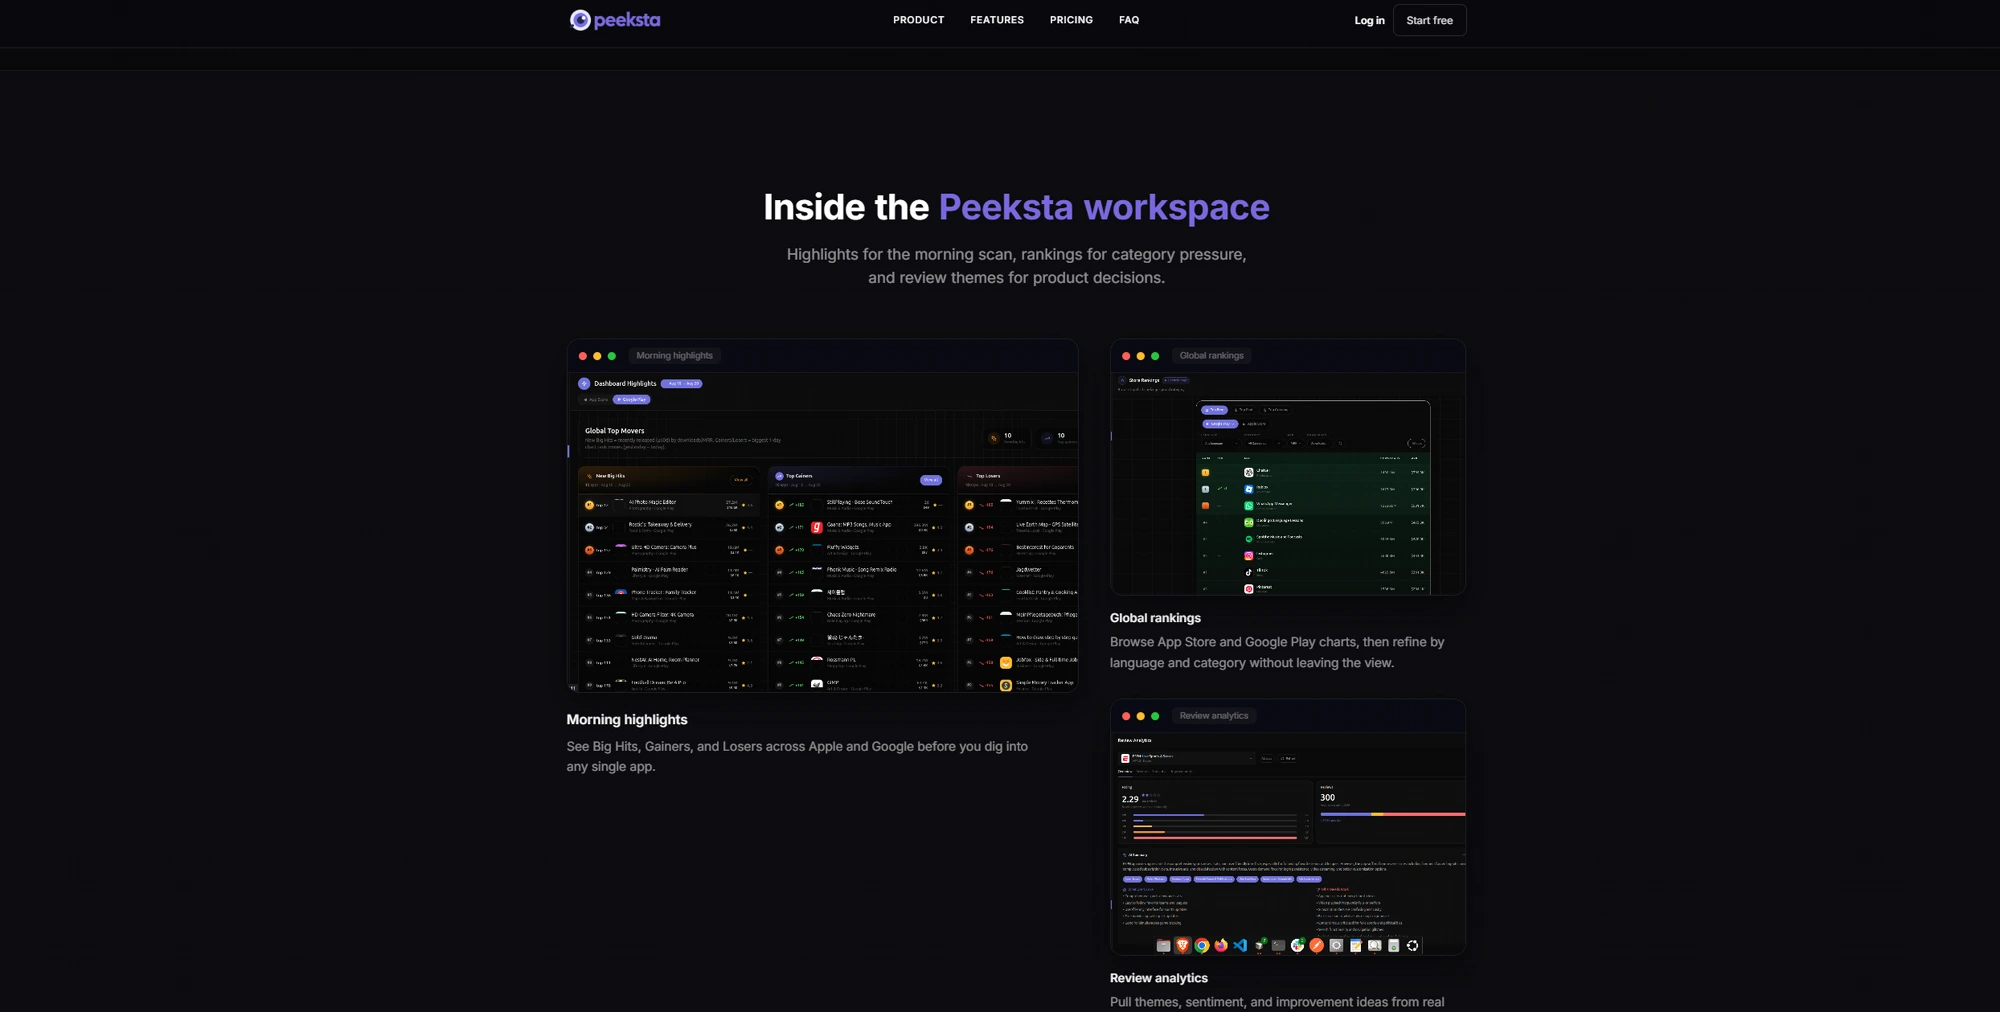
My morning routine takes fifteen minutes. Minea for the cross-platform view, Peeksta for TikTok velocity and store revenue. A product showing early momentum in both goes on the test list. A product showing up in only one gets three more days of watching.
The Validation Checklist
Before any product earns a test budget, it must pass four checks:
- Margins: you can sell it for at least three times the landed cost. Anything less dies the moment ad costs rise.
- Problem or wow factor: it solves a visible problem or produces an instant reaction on camera. Products that need explaining do not scale on paid social.
- Shipping reality: it is light, unbreakable, and not a sizing nightmare. Returns eat thin margins alive.
- Not saturated: fewer than five serious stores are actively scaling it right now. You verified this inside the tools, not by vibes.
The Trap: The Product Is Only 20% of the Work
Here is the part the gurus skip. Finding the product first feels like winning. It is not. It is a head start, and head starts expire within days. The same tools you use are used by thousands of other sellers, and one of them found the same product this morning.
What they cannot copy as fast is your execution: a sharp offer, a product page that answers objections, and creative that stops the scroll. Merchants who fail with winning products almost always fail at the offer, not the product. That has been the mizostoreforge position from day one: tools find you the opportunity, and fundamentals cash it in. If your store basics are shaky, fix them first with our guides on social proof and store design before you spend a dollar on ads.
The Sign-Off
Stop scrolling for products. Start measuring them. Set your filters to recent dates and rising engagement, watch the tier-2 markets for what comes next, and validate with real store revenue before you commit. Fifteen focused minutes with the right data beats three blind hours on TikTok. Every single morning.
Frequently Asked Questions
How much do product research tools cost?
Minea and Peeksta both sit in the range of a modest monthly subscription, with free or trial tiers so you can test the workflow first. One winning product pays for years of either subscription.
How many products should I test per month?
Two to four well-researched products beat fifteen random ones. Each test needs roughly three days of ad spend before you have clean enough data to kill it or scale it.
Can I find winning products without paid tools?
Yes, using the free TikTok Creative Center and the Facebook Ad Library. It works, but it is slower and shows you less. Paid tools buy you speed, and in product research speed is the entire edge.